Guided waves have been used for many years to find defects where there is no direct access to the area of interest. As this non-destructive testing methodology has matured and gained industry-wide acceptance, asset integrity requirements have become more stringent. Consequently, stakeholders now routinely demand the precise quantification of flaw morphology and severity, moving beyond detection.
The MRUT SIZING technique combines amplitude-based (SH0 wave mode) and frequency-based (SH1 wave mode) measurement techniques to provide highly accurate remaining wall thickness (RWT) measurements along the pipe. This defect sizing technique is designed to be used on pipes 0.25” to 1” in thickness (6-25 mm) and diameters ranging from NPS 6 to NPS 24.
This technique is available with Innerspec’s VOLTA 2 instrument and utilizes the MRUT SIZING scanner for both axial and circumferential inspection. Axial scanning integrates cutoff frequency and amplitude techniques to provide accurate remaining wall thickness (RWT) measurements, regardless of the corrosion profile (smooth or sharp). Circumferential scanning employs amplitude-based techniques to estimate remaining wall thickness.
By combining amplitude-based and frequency-based measurement techniques, Innerspec’s patented MRUT SIZING technique overcomes the limitations of cutoff frequency, providing reliable wall thickness measurements independently of the shape and depth of the corrosion.
The scanner generates guided waves on a magnetostrictive (MS) strip adhered axially to the pipe. The MS strip provides an unmatched signal-to-noise ratio (SNR), which is necessary for a high-quality assessment. For MRUT applications, it increases the SNR by >60 dB compared to conventional EMAT with periodic magnets.
This application note provides an overview of the technique and its implementation on the VOLTA 2 inspection platform. For detailed step-by-step instructions or further technical inquiries, please consult the manual or contact us.
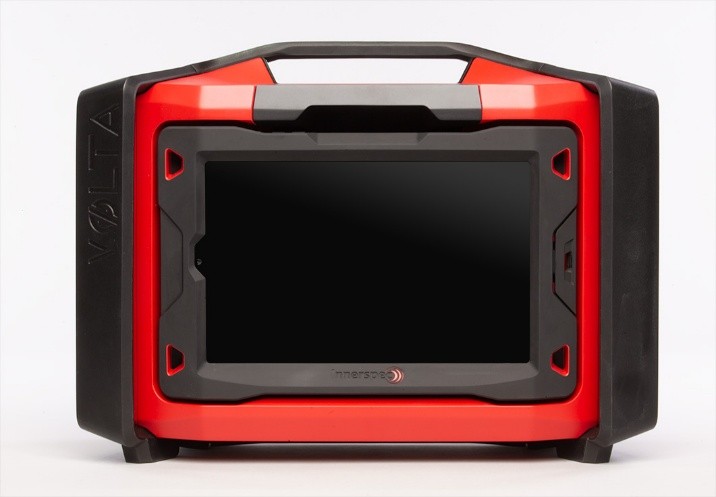
The MRUT SIZING technique is available with the VOLTA 2 inspection platform, a single, cost effective, and flexible platform that can cover all your guided wave inspection needs. VOLTA 2 can be used to perform any EMAT technique including Thickness Measurement, Weld Inspection, as well as Medium Range and Long Range Guided Wave techniques.
VOLTA 2 is a high-voltage, two-channel portable ultrasonic instrument designed for use with Electro Magnetic Acoustic Transducers (EMAT). It incorporates a proprietary pulser architecture capable of generating tone bursts from 1 to 10 cycles with output amplitudes up to 1,000 Vpp. The pulser design supports the high excitation energy requirements typical of EMAT-based inspections while maintaining a compact, field-deployable form factor.
Once the project, component, and tool data and settings have been entered, the first step is to apply the strip axially or circumferentially to the pipe, according to your inspection requirements. The strip can be cut to any size and reused multiple times. To learn more about the strip, please refer to the MS Strip Application Note.
For axial scanning, note that the sound propagates in both directions along the strip, creating a blind zone between approximately 180° from the strip's location. It is critical to position the strip so it is not directly opposite an area of interest. The figures below illustrate single and double-point strip configurations, where green areas represent 'safe' inspection zones and red areas represent 'blind' or suboptimal locations.

Channels 1 (Amplitude) and 2 (Frequency) are calibrated through a straightforward process by placing the scanner in the same position for both measurements on a clean section of the pipe. Calibration is performed within the software's TEST SCAN step. Circumferential scanning utilizes only Channel 1 (Amplitude).
An initial amplitude-based scan provides a fast assessment of the remaining wall thickness. Additional frequency-based scans taken at identified indication locations can refine the assessment when needed. These F-Scans are conducted by moving the sensor to the identified locations and pressing the F-SCAN button. The final result, shown in the ANALYSIS step, combines both amplitude and frequency to provide an estimate of the remaining wall along the scan.
Frequency scans are recommended when an area shows no reflection but significant signal attenuation, which could indicate a smooth and long defect, which is especially well-suited for the cutoff-frequency technique provided with this scan. They are also recommended in any area where the amplitude technique has identified a large indication to further corroborate the remaining wall results.
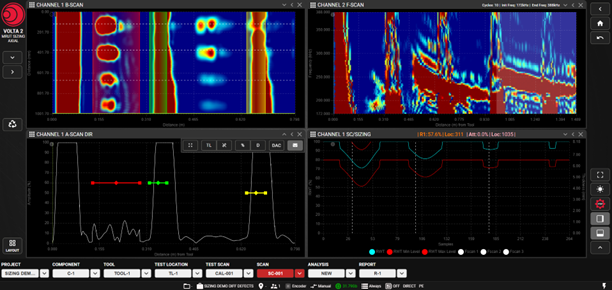
The results of the inspection are shown in four Custom Views in SCAN:
After completing data acquisition in the SCAN step, if frequency scans were performed, an automatic analysis combining amplitude and frequency sizing is finalized in the ANALYSIS step.
During the ANALYSIS step, automatic frequency cutoff measurements are integrated with amplitude data at the discrete points where frequency scans were taken. These combined measurements are displayed in the SC/Sizing chart, providing greater accuracy for the remaining wall thickness estimate.
ANALYSYS has four custom views:

VOLTA 2 software applications enable automated, customized reporting during the REPORT stage. The interface allows users to select specific data sets to customize the document. Reports can be exported and shared in PDF and XLSX formats.

The patented MRUT SIZING technique provides reliable results with superior productivity and inspection flexibility. The entire VOLTA 2 platform has been developed not only to deliver accurate results but also to offer unmatched flexibility and user-friendliness for seamless, on-site deployment and data sharing.
